

Hi everyone, welcome.
Grab some popcorn, or maybe some roasted peanuts. I have a story to tell. It’s a story of friendship and a big win against impossible odds.
No, I am not talking about the movie Sholay. I am talking about something that happened on my laptop yesterday. It felt just as epic as the movie.
For a long time, trying to create good AI images felt like I was the Thakur—standing there without arms, helpless against the Gabbar Singh of bad designs. I would type simple things like "a cool city," and the AI would give me boring, ugly pictures. It had no spark. It had no masala.
I needed help. I needed heroes.
And then, just when I was about to give up, I found my dynamic duo. Enter Claude and... wait for it... Nano Banana Pro.
(Yes, I know. "Nano Banana Pro." It sounds like a fruit Veeru might eat by mistake. But trust me, just wait until you hear what it does.)
Here is the thing. In Sholay, Jai was the brain. He was smart, calm, and knew exactly what to say. Veeru was the muscle. He was the action hero who got things done with style.
Together? They were unstoppable.
This is exactly what I found yesterday in my first experiment combining these two tools.
Claude is my Jai. Claude is a smart thinker. You don’t just give orders to Jai; you explain the plan. You give context. Claude takes your messy ideas and turns them into a perfect, detailed description.
Nano Banana Pro is my Veeru. It is the powerhouse artist. It doesn't want to think too hard; it just wants to paint! You give Veeru the plan that Jai wrote, point him in the right direction, and say, "Basanti, generate!" 😅 (Okay, don't say that; just hit enter.) And boom, it creates magic.
Yesterday was my first time trying this team-up. I was a bit nervous. I felt like I was tossing that coin, hoping for a win.
I wanted something hard to make. Not just a pretty picture. I wanted a futuristic building diagram that looked like an old-school comic book. Tough, right?
Step 1: Talking to Jai (Claude)
I went to Claude. I treated it like a partner.
I wrote, “Hey, Claude buddy. I need your help. I want to make an image that looks like a 1970s comic book. The subject is a high-tech floating city diagram. It needs labels and a rough texture. Can you write a very detailed description for this that I can give to an image generator?”
Claude didn't waste time. It acted just like Jai and gave me a paragraph of pure gold. It described the ink style, the colors, the font, everything.
Here's the full image description given by Claude:
A technical diagram of a futuristic floating city rendered in 1970s comic book style. The city should be a massive circular or disc-shaped platform suspended in the sky by visible anti-gravity generators or massive turbine arrays underneath. The illustration style should feature:

Visual Style:

Bold black ink outlines with varying thickness, typical of vintage comic book inking
Ben-Day dots texture and halftone patterns for shading (red, blue, yellow dots)
Rough, slightly misaligned color registration giving an authentic printed comic feel
Faded, slightly desaturated colors - muted oranges, teals, yellows, and purples
Visible paper texture with slight yellowing/aging
Cross-hatching and stippling for shadows and depth
The Floating City Structure:

Multi-tiered platform with distinct levels visible in cross-section
Retro-futuristic architecture: geodesic domes, angular buildings, communication towers
Exposed mechanical elements: pipes, girders, support struts
Glowing energy cores or power sources with radiating lines indicating energy
Landing pads with small aircraft or flying vehicles
Transparent tube transit systems connecting different sections
Labels and Annotations:

Hand-drawn style arrows pointing to different sections
Labels in bold, uppercase comic book lettering (font similar to Anime Ace or CC Wild Words)
Technical-sounding 1970s sci-fi labels like "FUSION REACTOR CORE," "ATMOSPHERIC STABILIZERS," "HYDROPONIC GARDENS," "ANTI-GRAV GENERATORS," "RESIDENTIAL SECTOR DELTA"
Small text boxes with additional technical specifications
Diagram grid lines or measurement indicators in the background
Composition:

Isometric or three-quarter view showing both the top city surface and the mechanical underbelly
Dynamic angle suggesting scale and grandeur
Background showing clouds below and sky above with simple gradient
Small human figures for scale reference
Vintage comic book border or frame around the entire image
The overall aesthetic should evoke the technical diagrams found in 1970s Marvel or DC comics, with that distinctive hand-drawn, slightly imperfect quality that makes it feel authentically retro rather than digitally perfect.
Step 2: Unleashing Veeru (Nano Banana Pro)
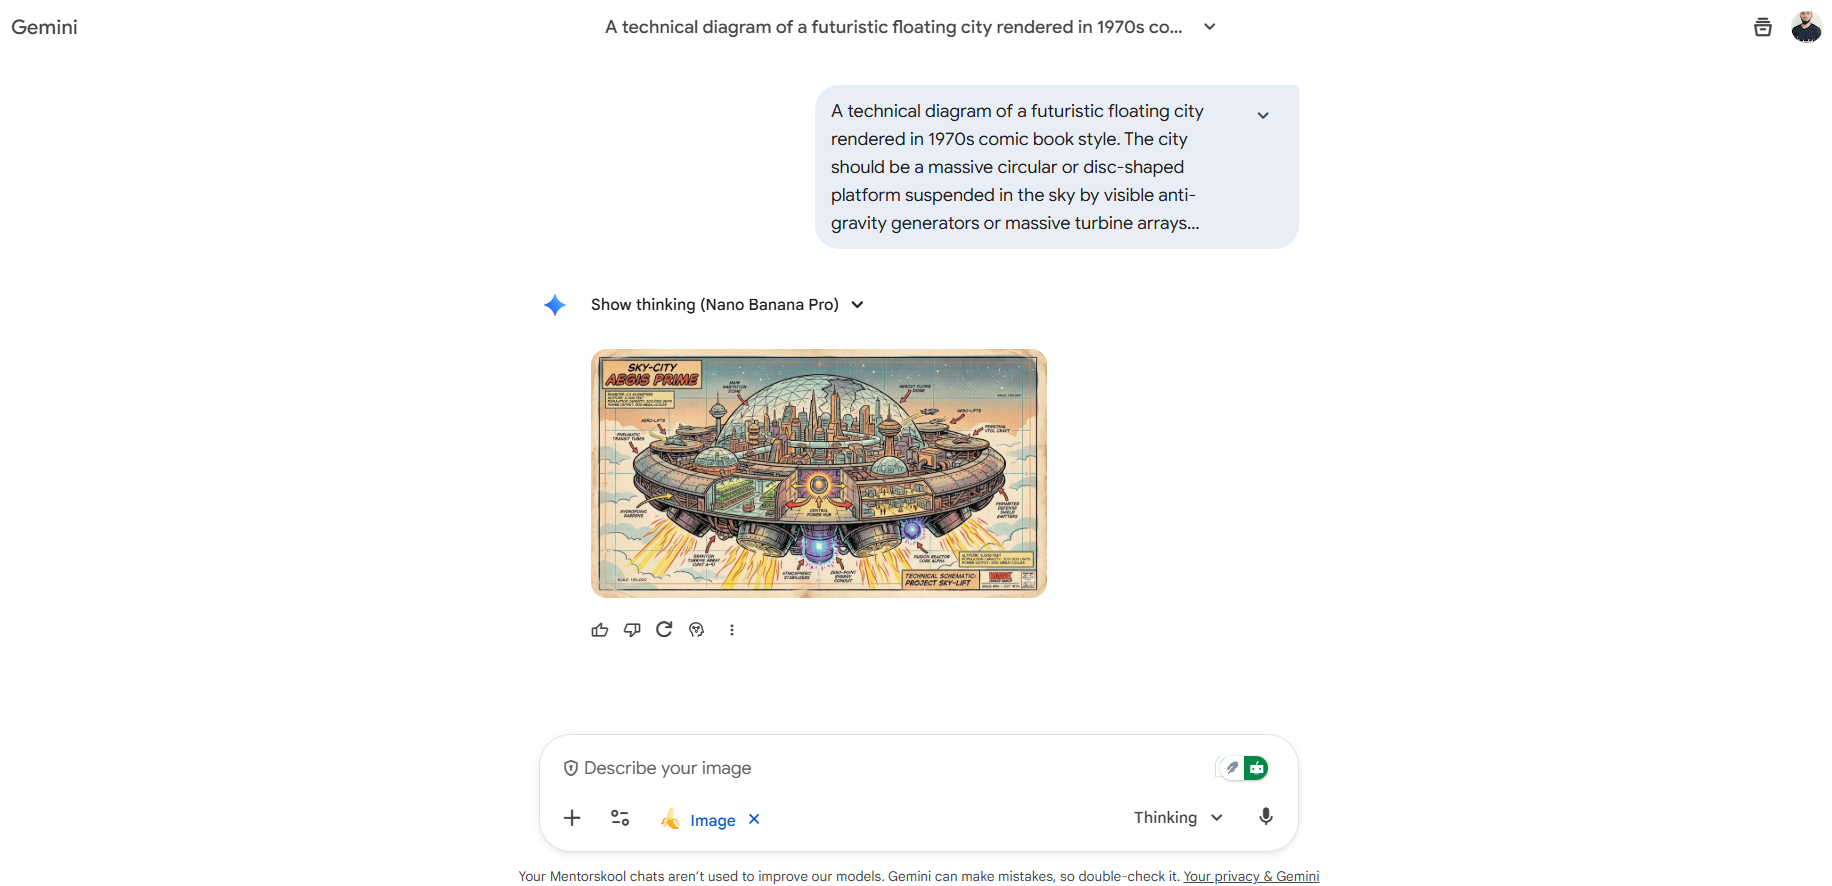
My hands were shaking a little. This was the moment of truth. I copied Claude’s text. I opened up Nano Banana Pro.
I pasted the text. I felt like I was handing Veeru a stick of dynamite.
I hit generate.
(Imagine the suspenseful harmonica music playing here...)
...
The Result? Mind = Blown.
Arre O Sambha! What I got back wasn't just good. It was exactly what I had in my head.
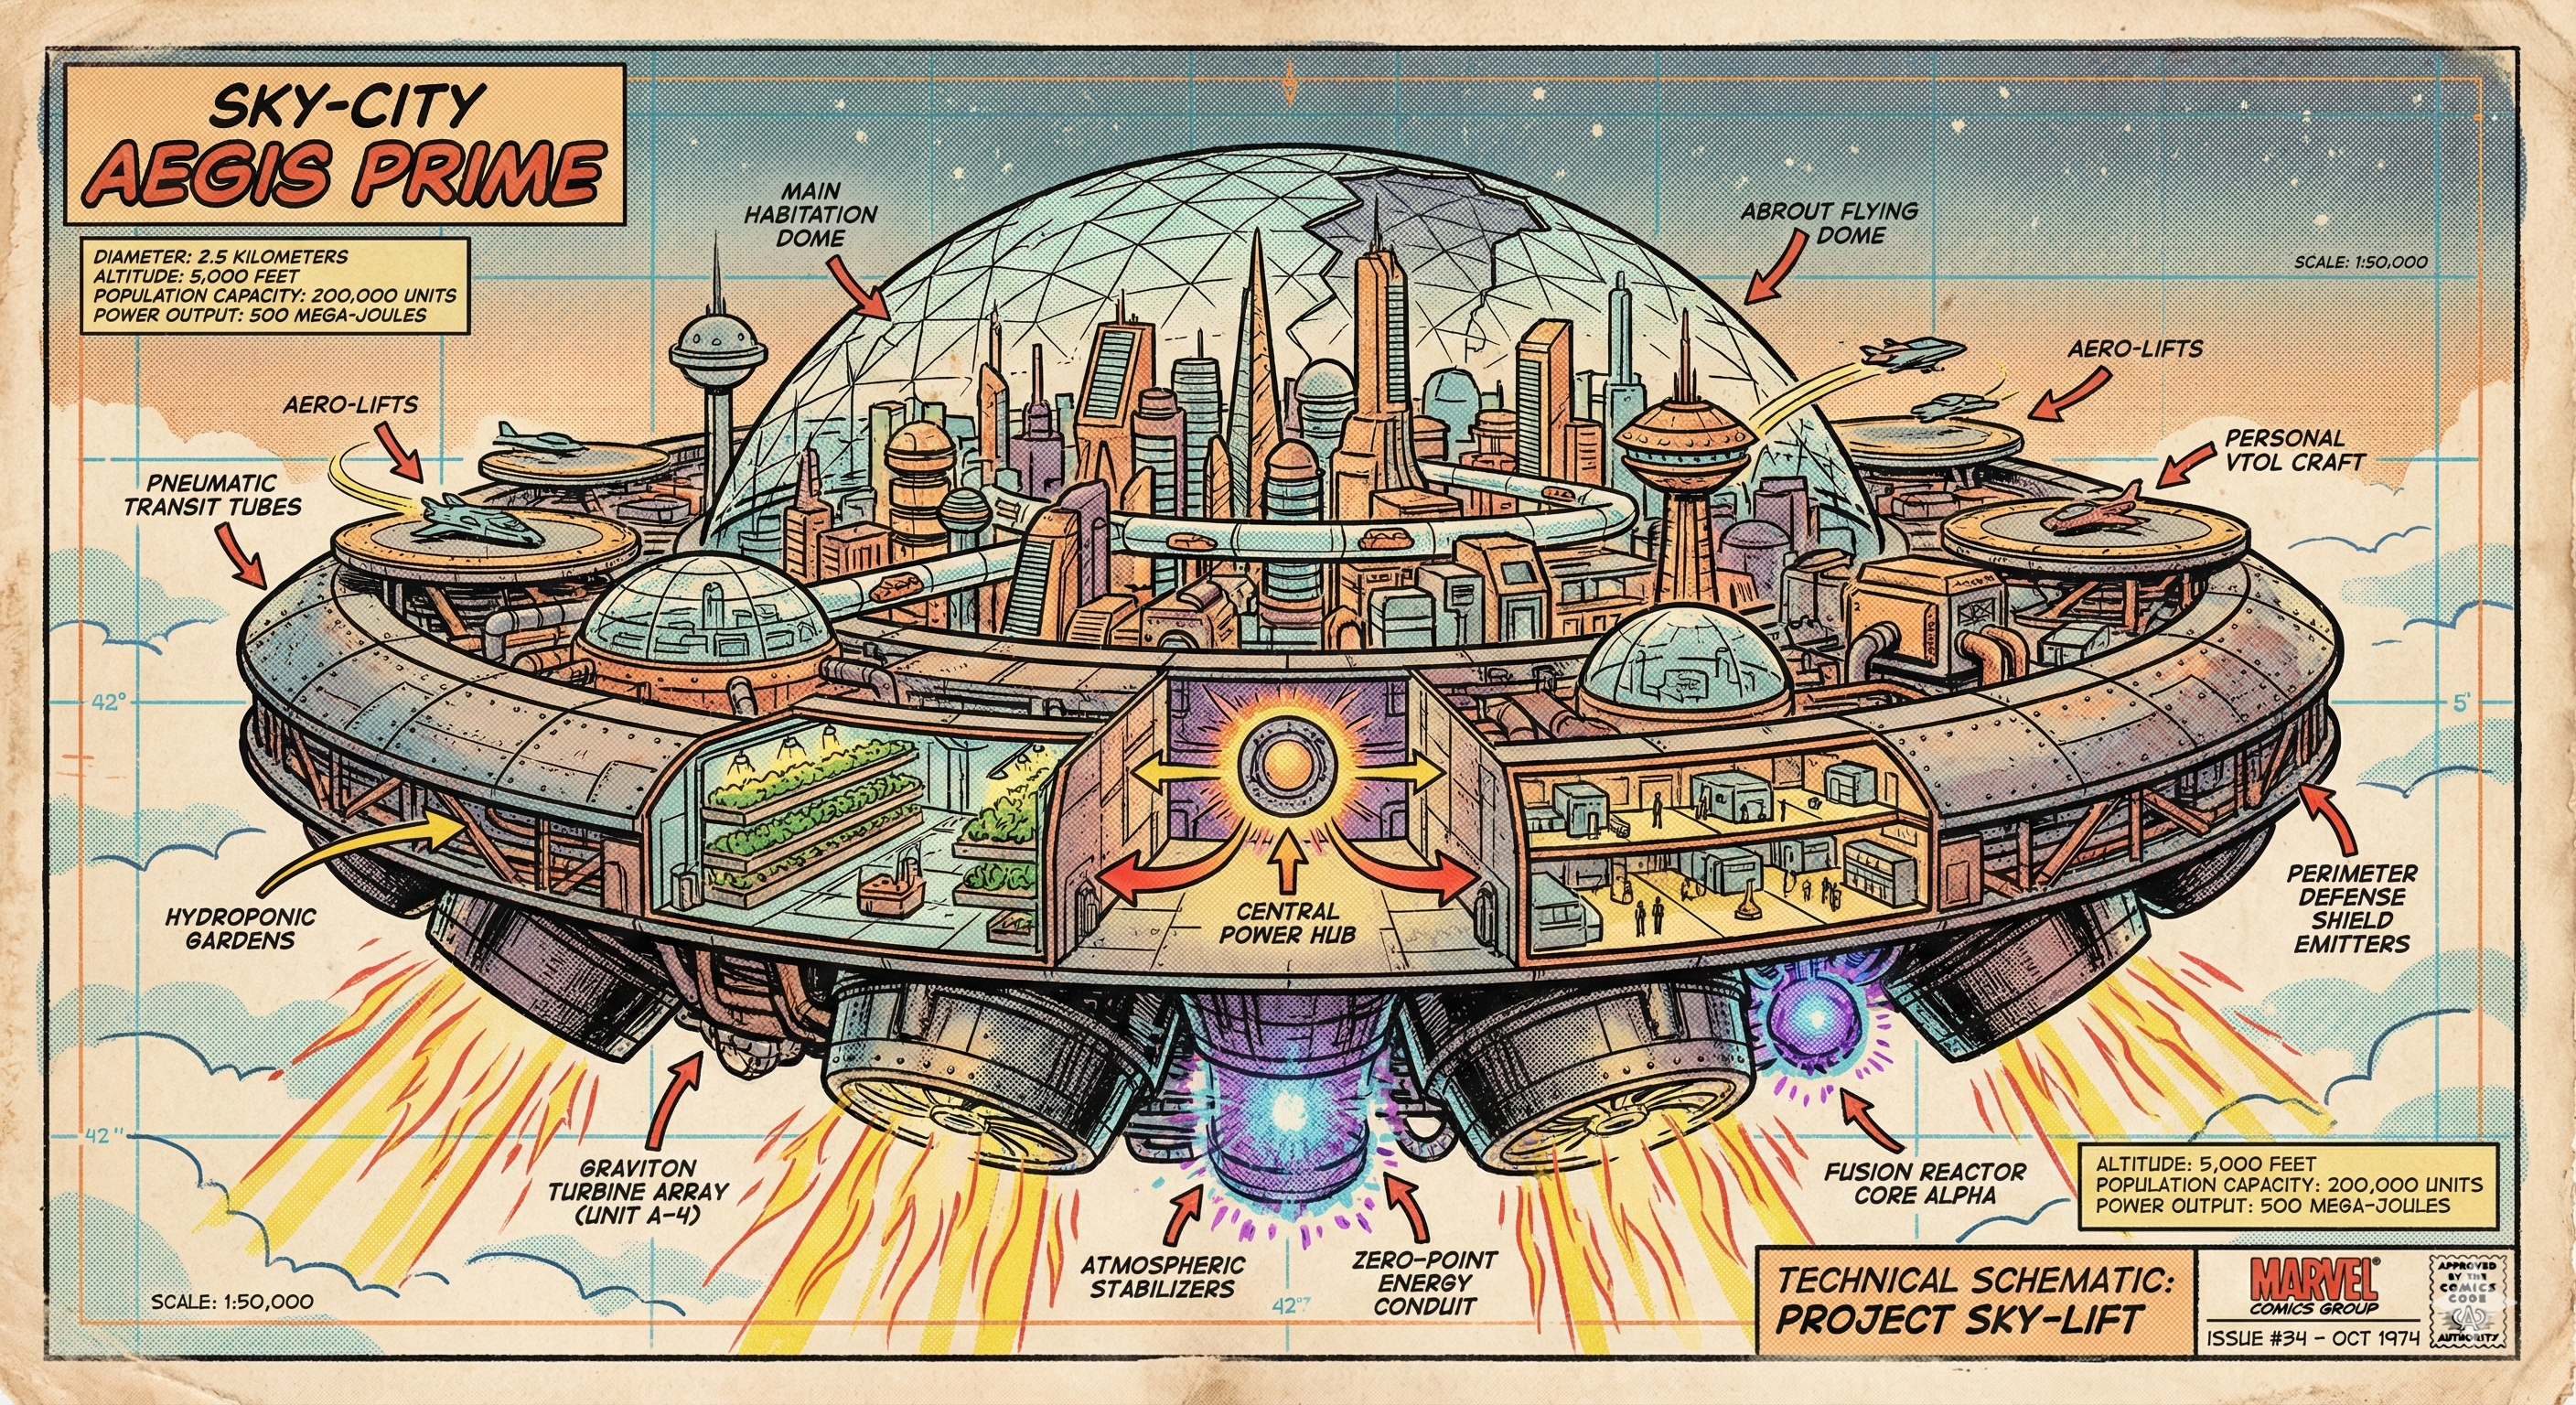
Nano Banana Pro took every little detail from Claude’s description, the old paper look, and the futuristic lines, and made it look perfect.
Here is the best part of my first day with this duo. This bond works for everything.
Architecture Diagrams? Jai plans it, and Veeru builds it.
Flowcharts? Claude explains the logic; Nano Banana makes it look cool instead of boring.
Blog Posters? Claude thinks of the idea; Nano Banana makes it pop.
The magic isn't in just one tool. It is in the yeh dosti (this friendship). You need a smart writer to help the strong artist.
If you are still struggling with bad AI images, stop fighting Gabbar alone. Go find your Jai (Claude), get that perfect text, and hand it over to your Veeru (Nano Banana Pro).
Trust me, this friendship isn't breaking anytime soon. Now, if you’ll excuse me, I have some more "coin tosses" to win!
New engineers shouldn't learn Docker like they're defusing a bomb. Here's how we created a fear-free learning environment—and cut training time in half." (165 characters)

A complete beginner’s guide to data quality, covering key challenges, real-world examples, and best practices for building trustworthy data.
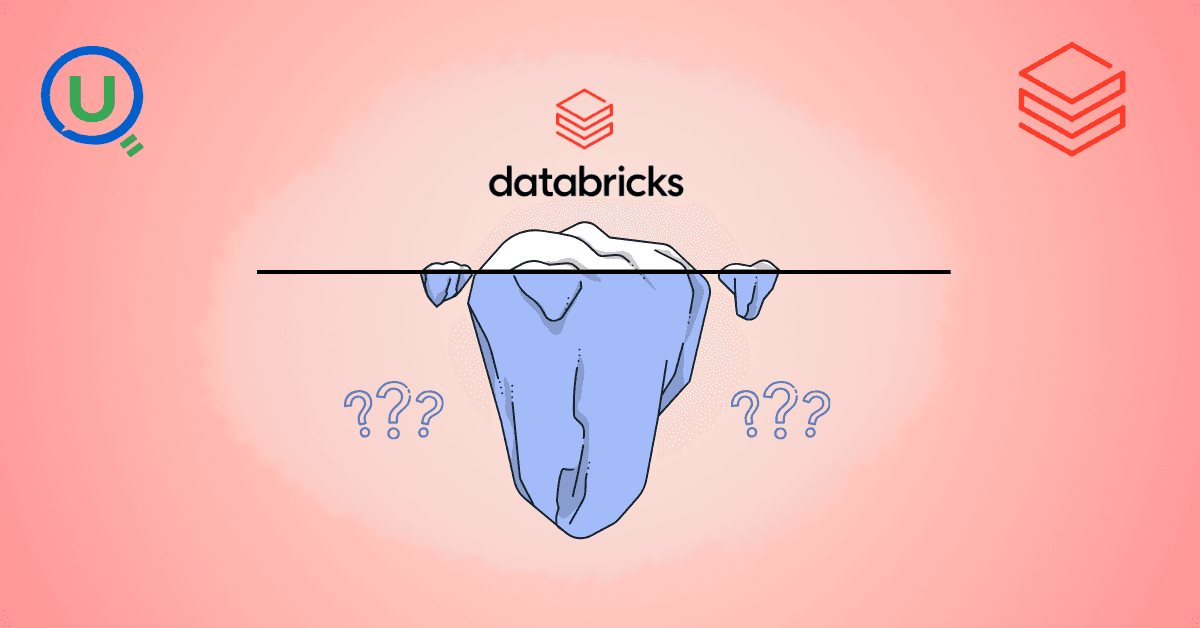
Explore the power of Databricks Lakehouse, Delta tables, and modern data engineering practices to build reliable, scalable, and high-quality data pipelines."

Ever wonder how Netflix instantly unlocks your account after payment, or how live sports scores update in real-time? It's all thanks to Change Data Capture (CDC). Instead of scanning entire databases repeatedly, CDC tracks exactly what changed. Learn how it works with real examples.
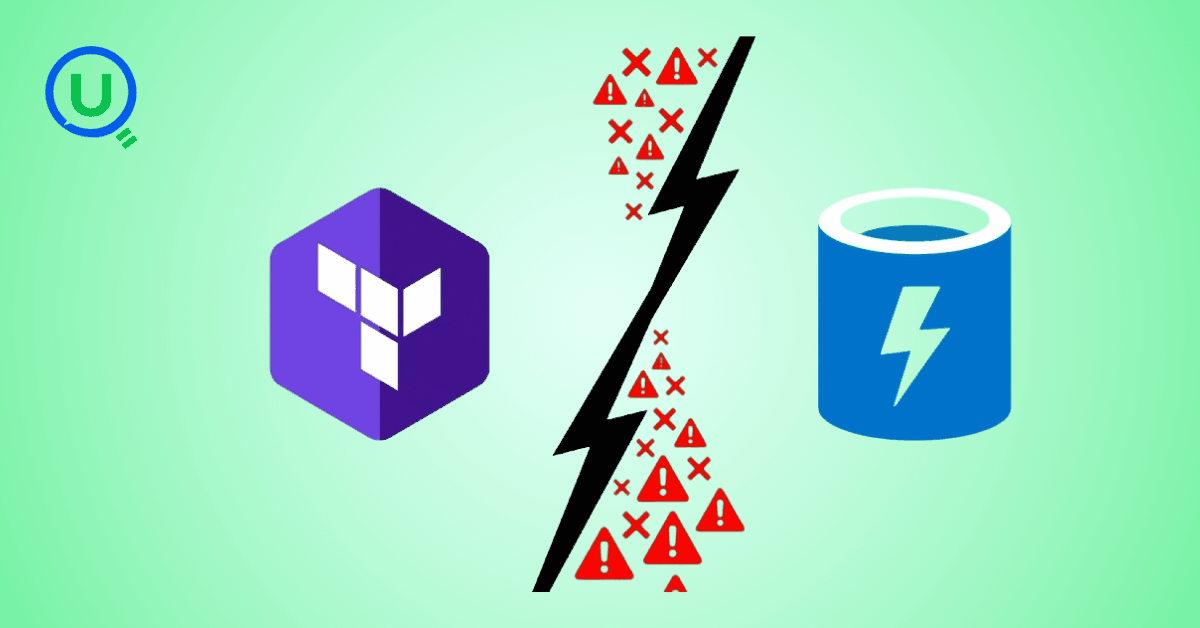
A real-world Terraform war story where a “simple” Azure SQL deployment spirals into seven hard-earned lessons, covering deprecated providers, breaking changes, hidden Azure policies, and why cloud tutorials age fast. A practical, honest read for anyone learning Infrastructure as Code the hard way.

From Excel to Interactive Dashboard: A hands-on journey building a dynamic pricing optimizer. I started with manual calculations in Excel to prove I understood the math, then automated the analysis with a Python pricing engine, and finally created an interactive Streamlit dashboard.
Data doesn’t wait - and neither should your insights. This blog breaks down streaming vs batch processing and shows, step by step, how to process real-time data using Azure Databricks.

A curious moment while shopping on Amazon turns into a deep dive into how Rufus, Amazon’s AI assistant, uses Generative AI, RAG, and semantic search to deliver real-time, accurate answers. This blog breaks down the architecture behind conversational commerce in a simple, story-driven way.

This blog talks about Databricks’ Unity Catalog upgrades -like Governed Tags, Automated Data Classification, and ABAC which make data governance smarter, faster, and more automated.
An honest, first-person account of learning dynamic pricing through hands-on Excel analysis. I tackled a real CPG problem : Should FreshJuice implement different prices for weekdays vs weekends across 30 retail stores?

What I thought would be a simple RBAC implementation turned into a comprehensive lesson in Kubernetes deployment. Part 1: Fixing three critical deployment errors. Part 2: Implementing namespace-scoped RBAC security. Real terminal outputs and lessons learned included

This blog walks you through how Databricks Connect completely transforms PySpark development workflow by letting us run Databricks-backed Spark code directly from your local IDE. From setup to debugging to best practices this Blog covers it all.

This blog unpacks how brands like Amazon and Domino’s decide who gets which coupon and why. Learn how simple RFM metrics turn raw purchase data into smart, personalised loyalty offers.

Learn how Snowflake's Query Acceleration Service provides temporary compute bursts for heavy queries without upsizing. Per-second billing, automatic scaling.

A simple ETL job broke into a 5-hour Kubernetes DNS nightmare. This blog walks through the symptoms, the chase, and the surprisingly simple fix.

A data engineer started a large cluster for a short task and couldn’t stop it due to limited permissions, leaving it idle and causing unnecessary cloud costs. This highlights the need for proper access control and auto-termination.

Say goodbye to deployment headaches. Learn how Databricks Asset Bundles keep your pipelines consistent, reproducible, and stress-free—with real-world examples and practical tips for data engineers.

Tracking sensitive data across Snowflake gets overwhelming fast. Learn how object tagging solved my data governance challenges with automated masking, instant PII discovery, and effortless scaling. From manual spreadsheets to systematic control. A practical guide for data professionals.

My first hand experience learning the essential concepts of Dynamic pricing

Running data quality checks on retail sales distribution data
This blog explores my experience with cleaning datasets during the process of performing EDA for analyzing whether geographical attributes impact sales of beverages

Snowflake recommends 100–250 MB files for optimal loading, but why? What happens when you load one large file versus splitting it into smaller chunks? I tested this with real data, and the results were surprising. Click to discover how this simple change can drastically improve loading performance.
Master the bronze layer foundation of medallion architecture with COPY INTO - the command that handles incremental ingestion and schema evolution automatically. No more duplicate data, no more broken pipelines when new columns arrive. Your complete guide to production-ready raw data ingestion

Learn Git and GitHub step by step with this complete guide. From Git basics to branching, merging, push, pull, and resolving merge conflicts—this tutorial helps beginners and developers collaborate like pros.

Discover how data management, governance, and security work together—just like your favorite food delivery app. Learn why these three pillars turn raw data into trusted insights, ensuring trust, compliance, and business growth.
Beginner’s journey in AWS Data Engineering—building a retail data pipeline with S3, Glue, and Athena. Key lessons on permissions, data lakes, and data quality. A hands-on guide for tackling real-world retail datasets.

A simple request to automate Google feedback forms turned into a technical adventure. From API roadblocks to a smart Google Apps Script pivot, discover how we built a seamless system that cut form creation time from 20 minutes to just 2.

Step-by-step journey of setting up end-to-end AKS monitoring with dashboards, alerts, workbooks, and real-world validations on Azure Kubernetes Service.

My learning experience tracing how an app works when browser is refreshed
Demonstrates the power of AI assisted development to build an end-to-end application grounds up
A hands-on learning journey of building a login and sign-up system from scratch using React, Node.js, Express, and PostgreSQL. Covers real-world challenges, backend integration, password security, and key full-stack development lessons for beginners.

This is the first in a five-part series detailing my experience implementing advanced data engineering solutions with Databricks on Google Cloud Platform. The series covers schema evolution, incremental loading, and orchestration of a robust ELT pipeline.

Discover the 7 major stages of the data engineering lifecycle, from data collection to storage and analysis. Learn the key processes, tools, and best practices that ensure a seamless and efficient data flow, supporting scalable and reliable data systems.

This blog is troubleshooting adventure which navigates networking quirks, uncovers why cluster couldn’t reach PyPI, and find the real fix—without starting from scratch.

Explore query scanning can be optimized from 9.78 MB down to just 3.95 MB using table partitioning. And how to use partitioning, how to decide the right strategy, and the impact it can have on performance and costs.

Dive deeper into query design, optimization techniques, and practical takeaways for BigQuery users.
Wondering when to use a stored procedure vs. a function in SQL? This blog simplifies the differences and helps you choose the right tool for efficient database management and optimized queries.

Discover how BigQuery Omni and BigLake break down data silos, enabling seamless multi-cloud analytics and cost-efficient insights without data movement.

In this article we'll build a motivation towards learning computer vision by solving a real world problem by hand along with assistance with chatGPT

This blog explains how Apache Airflow orchestrates tasks like a conductor leading an orchestra, ensuring smooth and efficient workflow management. Using a fun Romeo and Juliet analogy, it shows how Airflow handles timing, dependencies, and errors.

The blog underscores how snapshots and Point-in-Time Restore (PITR) are essential for data protection, offering a universal, cost-effective solution with applications in disaster recovery, testing, and compliance.

The blog contains the journey of ChatGPT, and what are the limitations of ChatGPT, due to which Langchain came into the picture to overcome the limitations and help us to create applications that can solve our real-time queries
This blog simplifies the complex world of data management by exploring two pivotal concepts: Data Lakes and Data Warehouses.
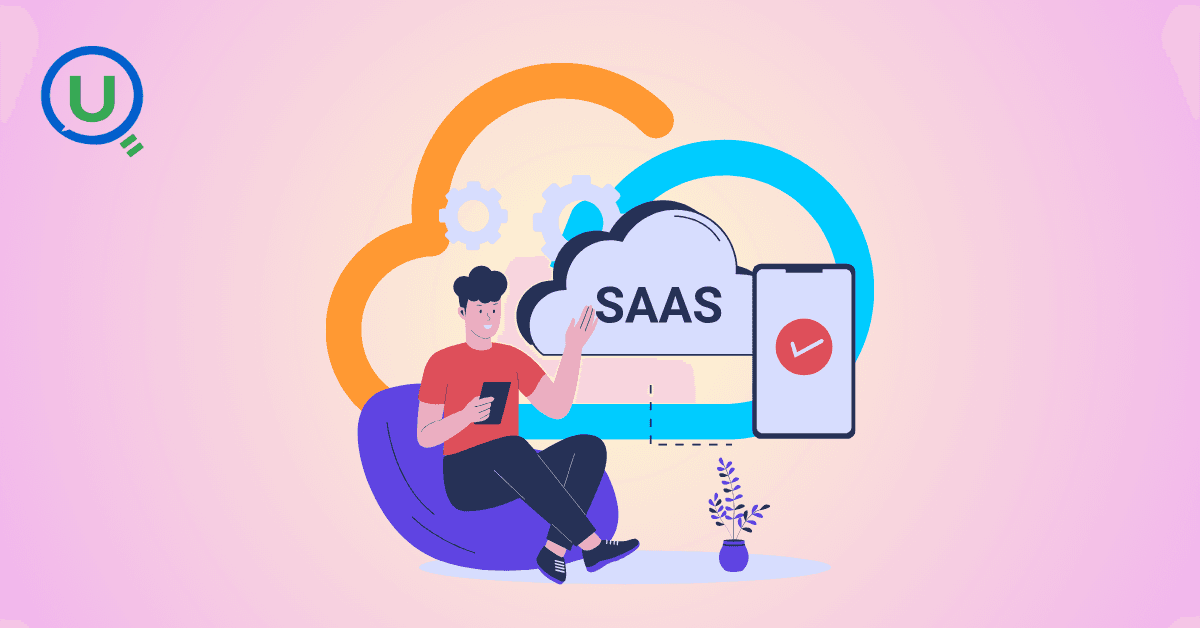
demystifying the concepts of IaaS, PaaS, and SaaS with Microsoft Azure examples

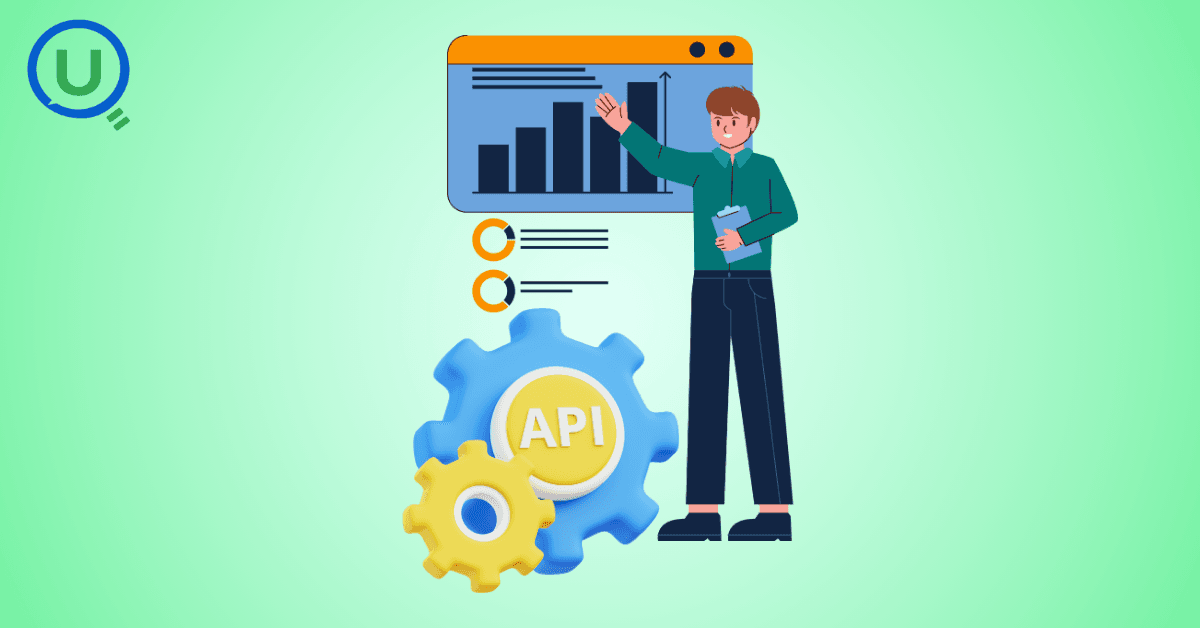
Discover how Azure Data Factory serves as the ultimate tool for data professionals, simplifying and automating data processes
Revolutionizing e-commerce with Azure Cosmos DB, enhancing data management, personalizing recommendations, real-time responsiveness, and gaining valuable insights.
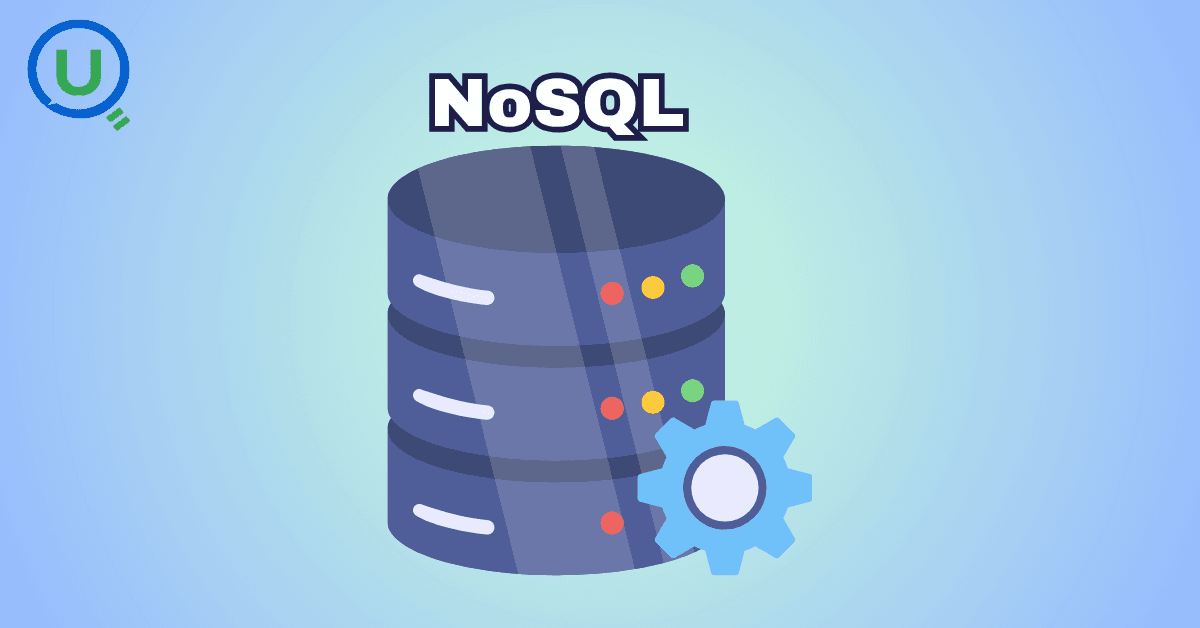
Highlights the benefits and applications of various NoSQL database types, illustrating how they have revolutionized data management for modern businesses.

This blog delves into the capabilities of Calendar Events Automation using App Script.
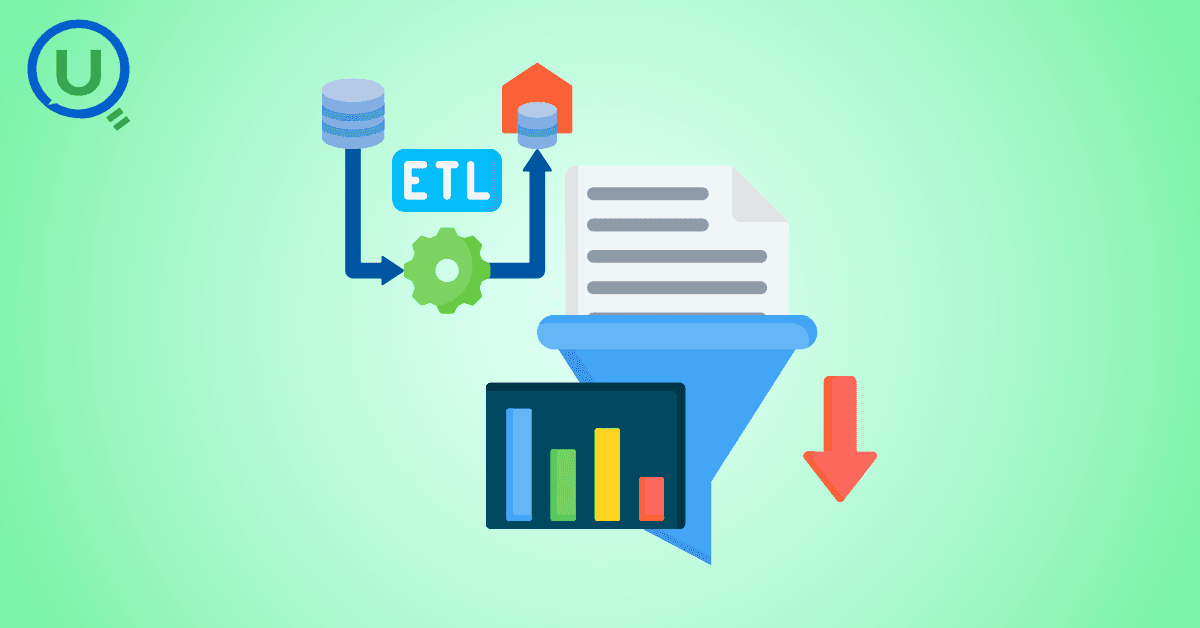
Dive into the fundamental concepts and phases of ETL, learning how to extract valuable data, transform it into actionable insights, and load it seamlessly into your systems.
An easy to follow guide prepared based on our experience with upskilling thousands of learners in Data Literacy

Teaching a Robot to Recognize Pastries with Neural Networks and artificial intelligence (AI)

Streamlining Storage Management for E-commerce Business by exploring Flat vs. Hierarchical Systems

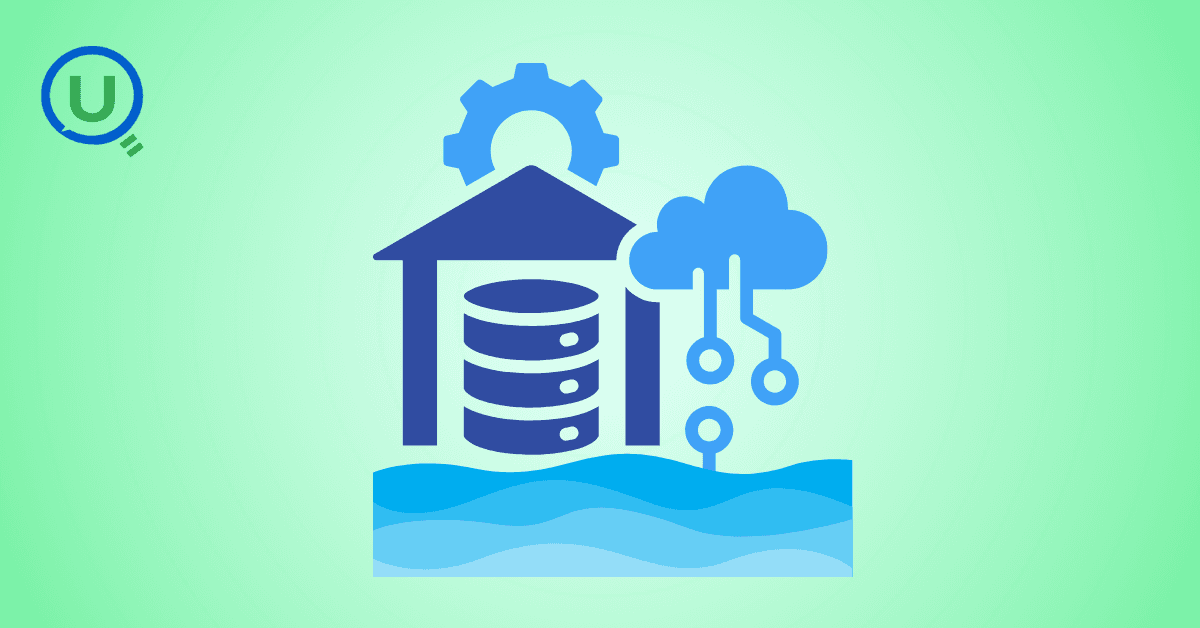
Figuring out how Cloud help reduce the Total Cost of Ownership of the IT infrastructure

Understand the circumstances which force organizations to start thinking about migration their business to cloud