
Imagine this:
A retail company launches a massive festival sale. Ads are live, inventory dashboards look green, and leadership is confident. Orders start pouring in… and then chaos.
- Customers receive wrong products
- Some orders are shipped twice
- Others are cancelled because the items were actually out of stock
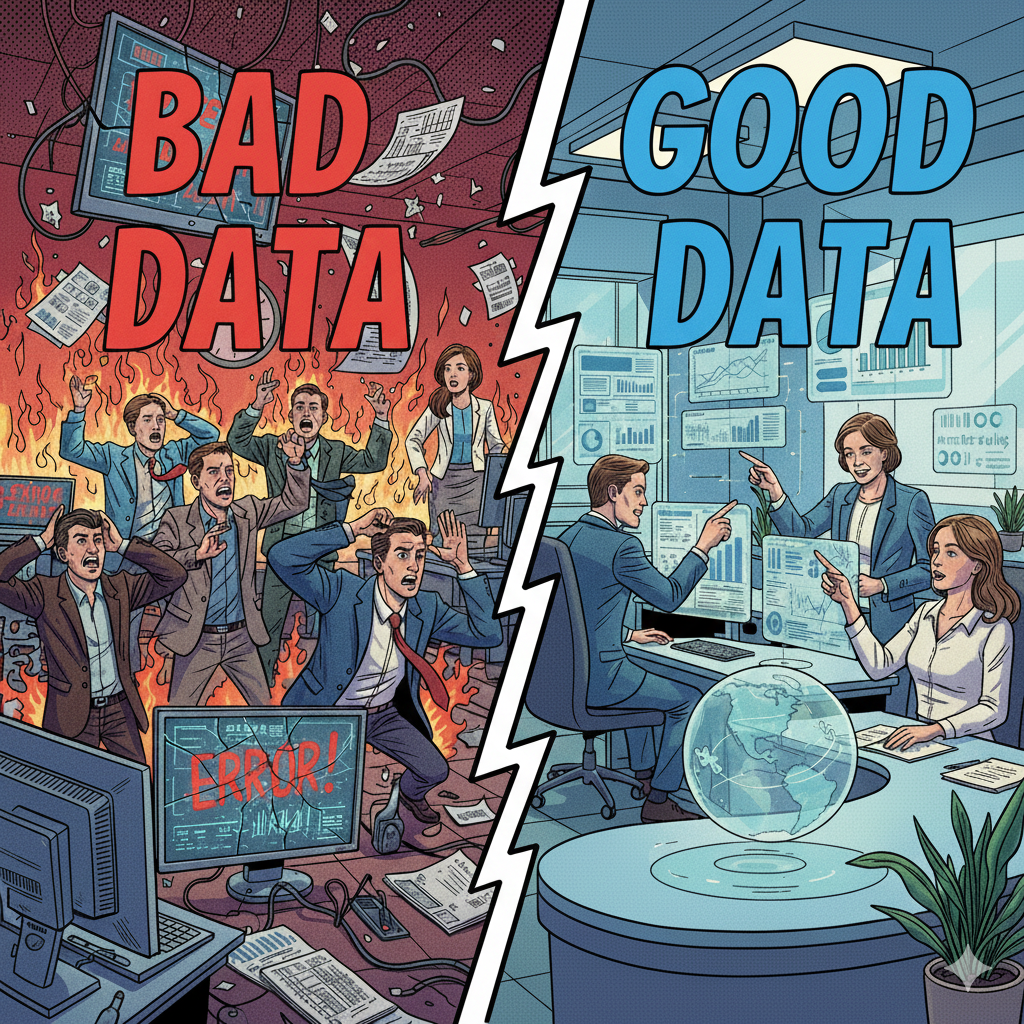
What went wrong?
Not the marketing. Not the warehouse. Not even the website.
--> The data.
Product quantities weren’t updated correctly. Customer addresses had missing fields. Duplicate records inflated inventory counts. By the time teams realized the issue, the company had already lost money, trust, and credibility.
This isn’t a rare horror story. This is what happens when data quality is ignored.
And that’s exactly why this guide exists.
In simple terms:
> Data Quality means how reliable, accurate, and usable your data is for decision‑making.
High‑quality data answers questions like:
- Can I trust this number?
- Is this data complete?
- Does it reflect reality right now?
Low‑quality data makes teams argue instead of decide.
No matter how good the analyst is, bad data ruin everything.
Data today isn’t just sitting quietly in reports. It actively drives how companies operate, decide, and automate.
In 2026, data is used to:
- Power business decisions
- Train AI and machine learning models
- Personalize customer experiences
- Detect fraud and anomalies
This changes the stakes completely.
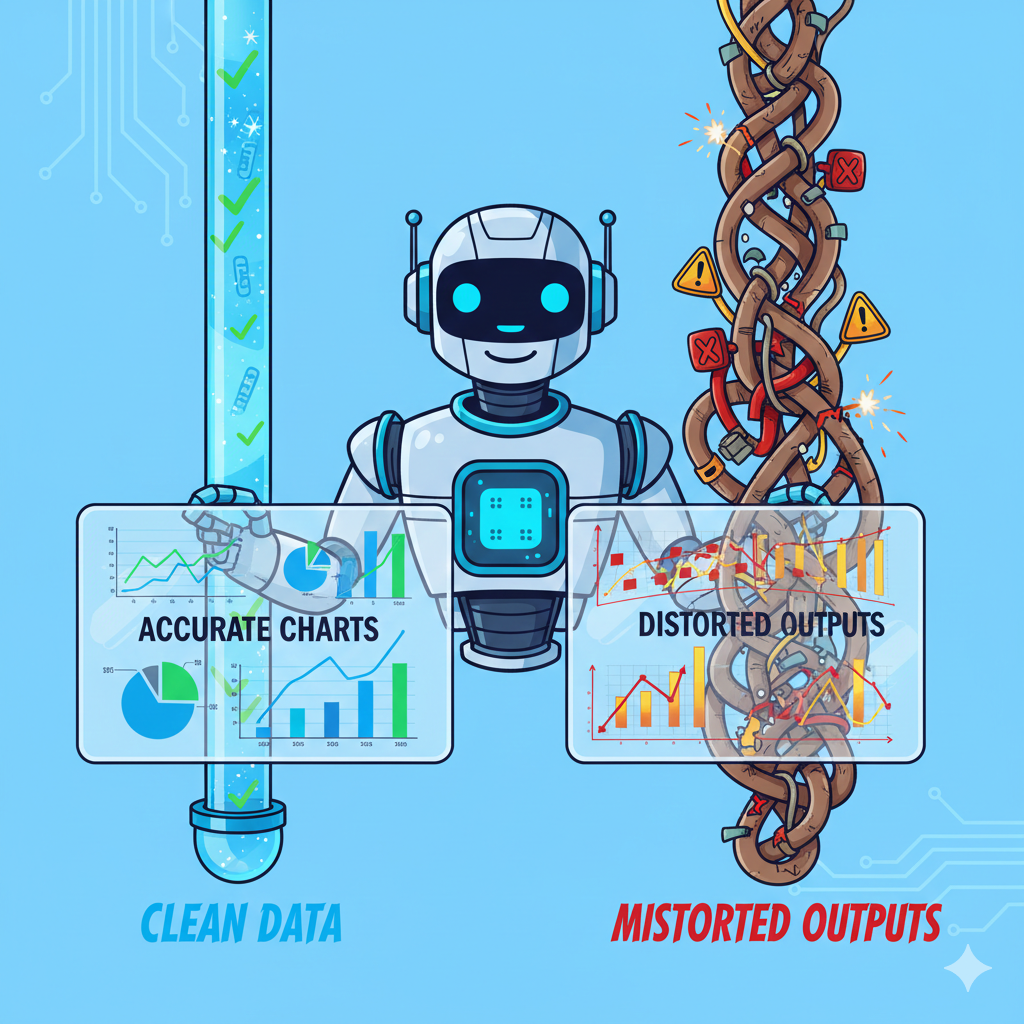
Here’s the uncomfortable truth:
> AI trained on bad data doesn’t become intelligent - it becomes confidently wrong.
Poor data quality no longer causes small mistakes. It causes systemic ones.
A single error can now:
- Spread across dashboards
- Influence automated decisions
- Impact thousands (or millions) of users
That’s why data quality has shifted from a backend concern to a business‑critical capability.
Poor data quality rarely announces itself clearly. Instead, it shows up as constant friction.
Teams start questioning numbers. Meetings turn into debates. Reports need explanations before they can be trusted.
In practice, bad data often leads to:
- Leadership seeing different numbers for the same metric
- Marketing targeting the wrong audience
- Finance misreporting revenue
- Operations planning with outdated information
The biggest hidden cost?
> Analysts spend more time fixing data than using it.
When data quality is poor, productivity quietly collapses.
Data quality is often discussed in abstract terms, but in real systems, issues usually fall into six very concrete buckets. These six dimensions show up repeatedly across industries, tools, and teams.
Let’s break them down with definitions that reflect how these problems actually appear in real data.
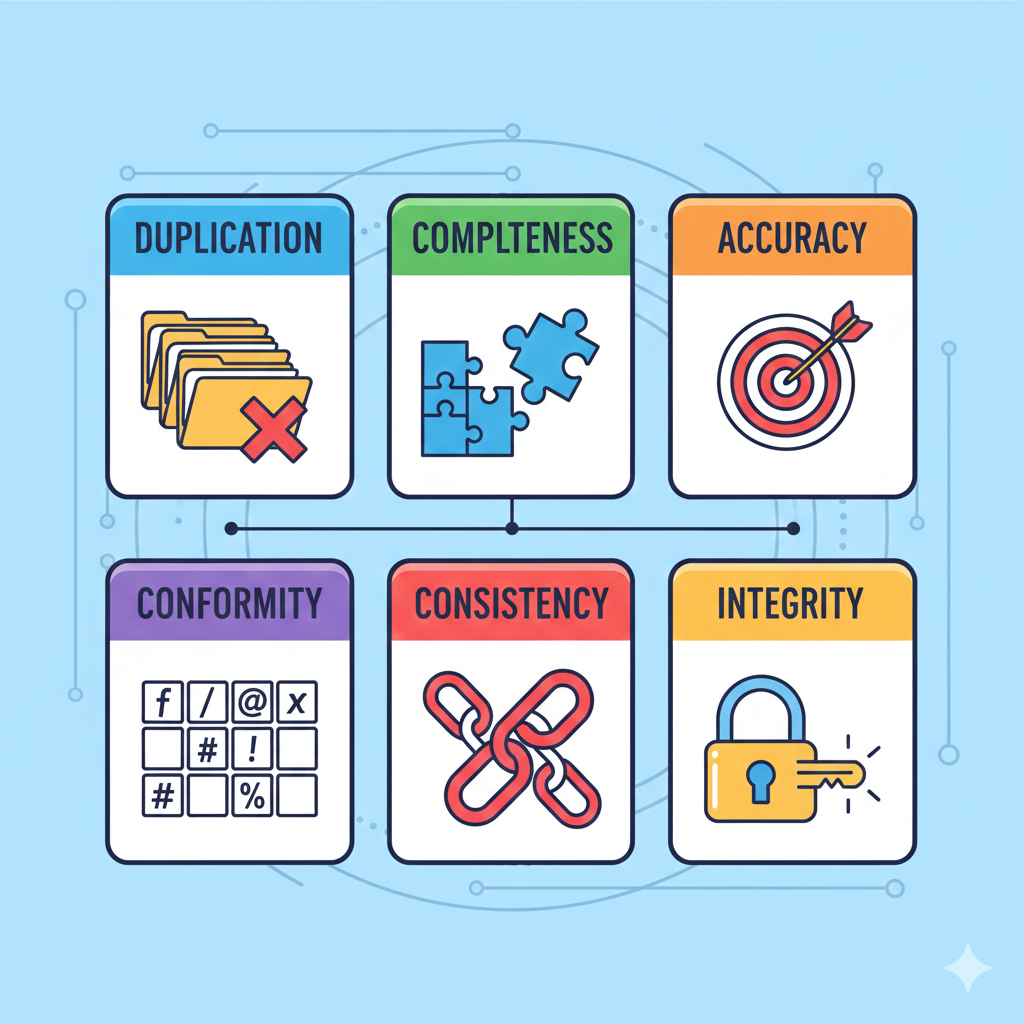
Definition: Duplication occurs when the same real‑world entity is recorded multiple times in the data.
Instead of one clean record, duplicates fragment information and inflate metrics.
Example:
- The same customer appears multiple times with slightly different names or contact details
Duplication quietly distorts counts, revenue, and customer insights, often without anyone noticing immediately.
Definition: Completeness measures whether all required data fields are present and populated.
Data can be technically correct and still be unusable if critical information is missing.
Example:
- Customer record without an email or phone number
- Order missing a delivery address
Incomplete data creates blind spots, forcing teams to guess instead of decide.
Definition: Accuracy reflects whether data correctly represents real‑world facts.
Inaccurate data may exist perfectly well inside systems, but it does not match reality.
Example:
- Customer ID C123 shows Nagpur in one system
- The same customer shows Jaipur in another system
When accuracy fails, trust collapses, even if the data looks clean on the surface.
Definition: Conformity ensures data follows standardized formats, naming conventions, and representations.
Here, the issue is not whether data is correct, but whether it is consistent in how it is written.
Examples:
- City stored as Bombay in one record and Mumbai in another
- Leading or trailing white spaces
- Multiple date formats within the same column
- Spelling variations for the same value
Poor conformity makes grouping, filtering, and analysis unreliable.
Definition: Consistency checks whether relationships and rules hold true across datasets.
Even if individual values look valid, the data may still contradict itself logically.
Example:
- A single order linked to two different customers
Inconsistent data breaks business logic and leads to incorrect joins and reports.
Definition: Integrity ensures that relationships between tables remain valid, usually enforced through primary and foreign keys.
Integrity issues arise when references point to records that don’t exist or shouldn’t exist.
Example:
- An order referencing a customer ID that does not exist in the customer table
When integrity breaks, downstream systems fail, sometimes silently, sometimes catastrophically.
No matter the industry, certain data quality issues appear again and again.
You’ll often encounter duplicate records, missing values, incorrect data types, and inconsistent formats. Dates might appear in different formats. IDs that should match don’t. Records that should exist simply don’t.
None of these issues are exotic. That’s what makes them dangerous.
They’re easy to ignore, until they break something important.
Spoiler: Not just bad analysts.
Common sources include:
- Manual data entry
- Multiple data sources
- Legacy systems
- Poor data validation rules
- Lack of ownership
- Fast‑moving businesses prioritizing speed over structure
Data breaks silently - until it doesn’t.
High‑quality data doesn’t come from heroic last‑minute cleaning. It comes from discipline and structure.
Start by defining clear data standards. Everyone should agree on what valid data looks like and which fields are mandatory.
Next, validate data as early as possible. Catching issues during ingestion is far cheaper than discovering them in reports.
Automation plays a crucial role here. Instead of manually checking datasets, teams monitor freshness, duplicates, and error rates automatically.
Ownership matters just as much. Every important dataset needs someone accountable for it. When ownership is unclear, quality degrades quickly.
Finally, document your data. A metric without context is just a number, and numbers without meaning create confusion.
Catch issues at ingestion, not during reporting.
Early checks save massive downstream effort.
Use rules to monitor:
- NULL percentages
- Duplicate counts
- Range violations
Automation > manual policing.
Every critical dataset should have an owner.
If everyone owns the data → no one owns the data.
Yes, data quality itself should be measured.
Examples:
- % completeness
- Error rate
- Freshness SLA
Clear definitions prevent confusion.
A number without context is just a rumor.
In 2026, data quality is baked into modern platforms:
- Data validation pipelines
- Lakehouse architectures
- Schema enforcement
- Observability tools
- Versioned datasets
Good tools help, but good thinking matters more.
In banking, poor data quality doesn’t just cause confusion - it causes risk.
Example:
- A customer’s income is outdated
- Credit score records are inconsistent across systems
Result:
- Wrong credit limits
- Higher default risk
- Regulatory penalties
That’s why banks invest heavily in validation rules and audit trails.
In healthcare, bad data can be life‑threatening.
Example:
- Duplicate patient records
- Missing allergy information
Result:
- Wrong medication
- Delayed treatment
- Compliance violations
Here, data quality is not about dashboards, but it’s about patient safety.
Example:
- Product prices differ across systems
- Inventory data is stale
Result:
- Revenue leakage
- Customer refunds
- Trust erosion
This is why modern e‑commerce platforms prioritize real‑time data freshness.
Before trusting any dataset, ask:
- Do I know where this data came from?
- Is any critical field missing?
- Does the data make logical sense?
- Is it recent enough for my use case?
- Are there obvious duplicates?
If the answer is “I’m not sure” -- pause before using it.
Many beginners confuse these.
- Data Cleaning: Fixing existing issues
- Data Quality: Preventing issues from happening again
Cleaning is reactive.
Quality is proactive.
Mature data teams focus on both.
Short answer: Everyone, but in different ways.
- Engineers ensure correct ingestion
- Analysts validate business logic
- Business teams define what “correct” means
- Leaders enforce accountability
Without shared responsibility, quality always breaks.
Here’s the truth:
> Data quality isn’t a one‑time task. It’s a habit.
Clean dashboards don’t come from magic.
Reliable AI doesn’t happen by accident.
Trustworthy decisions start with trustworthy data.
If you remember just one thing from this guide, let it be this:
> Great decisions are built on great data, and great data is intentional.
Welcome to the world of data quality. ✨

New engineers shouldn't learn Docker like they're defusing a bomb. Here's how we created a fear-free learning environment—and cut training time in half." (165 characters)
Explore the power of Databricks Lakehouse, Delta tables, and modern data engineering practices to build reliable, scalable, and high-quality data pipelines."

Ever wonder how Netflix instantly unlocks your account after payment, or how live sports scores update in real-time? It's all thanks to Change Data Capture (CDC). Instead of scanning entire databases repeatedly, CDC tracks exactly what changed. Learn how it works with real examples.
A real-world Terraform war story where a “simple” Azure SQL deployment spirals into seven hard-earned lessons, covering deprecated providers, breaking changes, hidden Azure policies, and why cloud tutorials age fast. A practical, honest read for anyone learning Infrastructure as Code the hard way.

From Excel to Interactive Dashboard: A hands-on journey building a dynamic pricing optimizer. I started with manual calculations in Excel to prove I understood the math, then automated the analysis with a Python pricing engine, and finally created an interactive Streamlit dashboard.

Data doesn’t wait - and neither should your insights. This blog breaks down streaming vs batch processing and shows, step by step, how to process real-time data using Azure Databricks.

A curious moment while shopping on Amazon turns into a deep dive into how Rufus, Amazon’s AI assistant, uses Generative AI, RAG, and semantic search to deliver real-time, accurate answers. This blog breaks down the architecture behind conversational commerce in a simple, story-driven way.

This blog talks about Databricks’ Unity Catalog upgrades -like Governed Tags, Automated Data Classification, and ABAC which make data governance smarter, faster, and more automated.

Tired of boring images? Meet the 'Jai & Veeru' of AI! See how combining Claude and Nano Banana Pro creates mind-blowing results for comics, diagrams, and more.
An honest, first-person account of learning dynamic pricing through hands-on Excel analysis. I tackled a real CPG problem : Should FreshJuice implement different prices for weekdays vs weekends across 30 retail stores?

What I thought would be a simple RBAC implementation turned into a comprehensive lesson in Kubernetes deployment. Part 1: Fixing three critical deployment errors. Part 2: Implementing namespace-scoped RBAC security. Real terminal outputs and lessons learned included

This blog walks you through how Databricks Connect completely transforms PySpark development workflow by letting us run Databricks-backed Spark code directly from your local IDE. From setup to debugging to best practices this Blog covers it all.

This blog unpacks how brands like Amazon and Domino’s decide who gets which coupon and why. Learn how simple RFM metrics turn raw purchase data into smart, personalised loyalty offers.
Learn how Snowflake's Query Acceleration Service provides temporary compute bursts for heavy queries without upsizing. Per-second billing, automatic scaling.

A simple ETL job broke into a 5-hour Kubernetes DNS nightmare. This blog walks through the symptoms, the chase, and the surprisingly simple fix.

A data engineer started a large cluster for a short task and couldn’t stop it due to limited permissions, leaving it idle and causing unnecessary cloud costs. This highlights the need for proper access control and auto-termination.

Say goodbye to deployment headaches. Learn how Databricks Asset Bundles keep your pipelines consistent, reproducible, and stress-free—with real-world examples and practical tips for data engineers.

Tracking sensitive data across Snowflake gets overwhelming fast. Learn how object tagging solved my data governance challenges with automated masking, instant PII discovery, and effortless scaling. From manual spreadsheets to systematic control. A practical guide for data professionals.

My first hand experience learning the essential concepts of Dynamic pricing

Running data quality checks on retail sales distribution data
This blog explores my experience with cleaning datasets during the process of performing EDA for analyzing whether geographical attributes impact sales of beverages

Snowflake recommends 100–250 MB files for optimal loading, but why? What happens when you load one large file versus splitting it into smaller chunks? I tested this with real data, and the results were surprising. Click to discover how this simple change can drastically improve loading performance.
Master the bronze layer foundation of medallion architecture with COPY INTO - the command that handles incremental ingestion and schema evolution automatically. No more duplicate data, no more broken pipelines when new columns arrive. Your complete guide to production-ready raw data ingestion

Learn Git and GitHub step by step with this complete guide. From Git basics to branching, merging, push, pull, and resolving merge conflicts—this tutorial helps beginners and developers collaborate like pros.

Discover how data management, governance, and security work together—just like your favorite food delivery app. Learn why these three pillars turn raw data into trusted insights, ensuring trust, compliance, and business growth.
Beginner’s journey in AWS Data Engineering—building a retail data pipeline with S3, Glue, and Athena. Key lessons on permissions, data lakes, and data quality. A hands-on guide for tackling real-world retail datasets.

A simple request to automate Google feedback forms turned into a technical adventure. From API roadblocks to a smart Google Apps Script pivot, discover how we built a seamless system that cut form creation time from 20 minutes to just 2.

Step-by-step journey of setting up end-to-end AKS monitoring with dashboards, alerts, workbooks, and real-world validations on Azure Kubernetes Service.

My learning experience tracing how an app works when browser is refreshed

Demonstrates the power of AI assisted development to build an end-to-end application grounds up
A hands-on learning journey of building a login and sign-up system from scratch using React, Node.js, Express, and PostgreSQL. Covers real-world challenges, backend integration, password security, and key full-stack development lessons for beginners.

This is the first in a five-part series detailing my experience implementing advanced data engineering solutions with Databricks on Google Cloud Platform. The series covers schema evolution, incremental loading, and orchestration of a robust ELT pipeline.

Discover the 7 major stages of the data engineering lifecycle, from data collection to storage and analysis. Learn the key processes, tools, and best practices that ensure a seamless and efficient data flow, supporting scalable and reliable data systems.

This blog is troubleshooting adventure which navigates networking quirks, uncovers why cluster couldn’t reach PyPI, and find the real fix—without starting from scratch.

Explore query scanning can be optimized from 9.78 MB down to just 3.95 MB using table partitioning. And how to use partitioning, how to decide the right strategy, and the impact it can have on performance and costs.

Dive deeper into query design, optimization techniques, and practical takeaways for BigQuery users.

Wondering when to use a stored procedure vs. a function in SQL? This blog simplifies the differences and helps you choose the right tool for efficient database management and optimized queries.

Discover how BigQuery Omni and BigLake break down data silos, enabling seamless multi-cloud analytics and cost-efficient insights without data movement.

In this article we'll build a motivation towards learning computer vision by solving a real world problem by hand along with assistance with chatGPT

This blog explains how Apache Airflow orchestrates tasks like a conductor leading an orchestra, ensuring smooth and efficient workflow management. Using a fun Romeo and Juliet analogy, it shows how Airflow handles timing, dependencies, and errors.

The blog underscores how snapshots and Point-in-Time Restore (PITR) are essential for data protection, offering a universal, cost-effective solution with applications in disaster recovery, testing, and compliance.

The blog contains the journey of ChatGPT, and what are the limitations of ChatGPT, due to which Langchain came into the picture to overcome the limitations and help us to create applications that can solve our real-time queries
This blog simplifies the complex world of data management by exploring two pivotal concepts: Data Lakes and Data Warehouses.

demystifying the concepts of IaaS, PaaS, and SaaS with Microsoft Azure examples

Discover how Azure Data Factory serves as the ultimate tool for data professionals, simplifying and automating data processes

Revolutionizing e-commerce with Azure Cosmos DB, enhancing data management, personalizing recommendations, real-time responsiveness, and gaining valuable insights.
Highlights the benefits and applications of various NoSQL database types, illustrating how they have revolutionized data management for modern businesses.

This blog delves into the capabilities of Calendar Events Automation using App Script.
Dive into the fundamental concepts and phases of ETL, learning how to extract valuable data, transform it into actionable insights, and load it seamlessly into your systems.

An easy to follow guide prepared based on our experience with upskilling thousands of learners in Data Literacy

Teaching a Robot to Recognize Pastries with Neural Networks and artificial intelligence (AI)

Streamlining Storage Management for E-commerce Business by exploring Flat vs. Hierarchical Systems

Figuring out how Cloud help reduce the Total Cost of Ownership of the IT infrastructure

Understand the circumstances which force organizations to start thinking about migration their business to cloud