
I was working on a problem statement about understanding Snowflake's clone retention behavior.
The plan was straightforward: create a table, clone it, drop the original, and watch the metrics update. I'd document the "expected output" at each step.
Except, when I actually ran the code myself, nothing worked the way I expected.
I dropped a table and immediately checked storage metrics. The table I'd just deleted was still there, showing active storage like nothing happened. I tried dropping it again. Snowflake threw an error: Table doesn't exist!
So which is it? Does the table exist or not?
That's when I realized: I didn't understand Snowflake's metadata systems nearly as well as I thought I did.
Over the next few days, I discovered four non-obvious behaviors that completely changed how I approach clone monitoring, cost analysis, and automation in Snowflake. Here's what I learned.
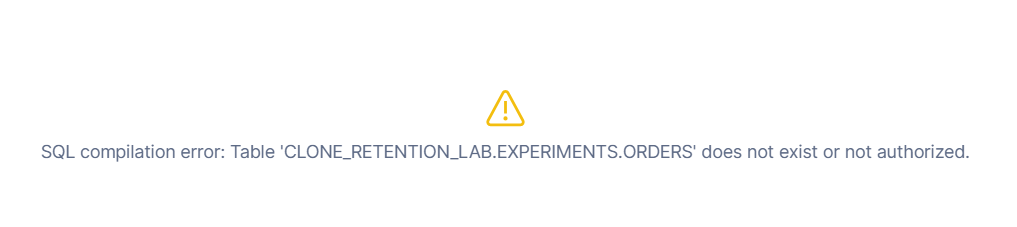
I created two tables ORDERS & ORDERS_DEV which is a clone of the original orders table. I then proceeded to drop the ORDERS table, but like discussed earlier, I could still see this table taking active storage in my Snowflake Account.
When I tried dropping it again to verify, Snowflake confirmed it was gone:
 Perfect. Now let me check storage metrics:
SELECT
    table_name,
    active_bytes / 1024 / 1024 AS active_mb,
    time_travel_bytes / 1024 / 1024 AS time_travel_mb,
    failsafe_bytes / 1024 / 1024 AS failsafe_mb,
    retained_for_clone_bytes / 1024 / 1024 AS retained_clone_mb
FROM information_schema.table_storage_metrics
WHERE table_schema = 'EXPERIMENTS'
  AND table_name = 'ORDERS';
What I saw:
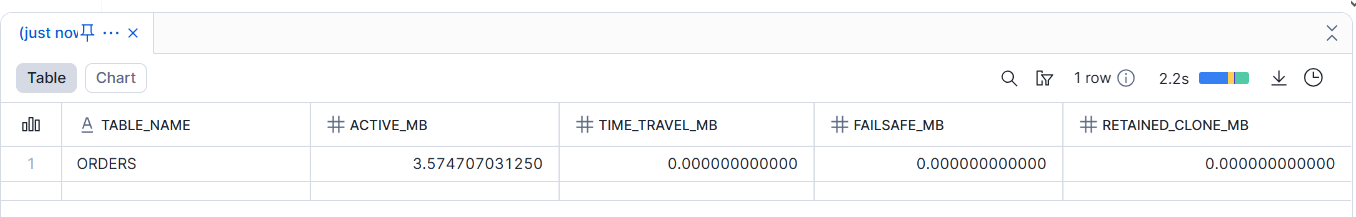 Wait.
Wait. ORDERS is showing 3.57 MB of active storage? The table that doesn't exist?
INFORMATION_SCHEMA reads from metadata snapshots that refresh every 5-15 minutes. When I dropped the table:
Snowflake's control plane updated immediately ✓
The metadata snapshot? Refreshed on its own schedule
INFORMATION_SCHEMA read from that slightly outdated snapshot
I tried disabling query cache with USE_CACHED_RESULT = FALSE. Still showed stale data.
Turns out USE_CACHED_RESULT only affects the 24-hour query result cache, not metadata freshness. These are separate systems.
There's a 5-15 minute lag to update the INFORMATION_SCHEMA after DDL operations
Use ACCOUNT_USAGE for billing analysis. It has 45min-3hr latency, but it's the authoritative source
If your script drops tables and immediately checks metrics, expect mismatches
This isn't a bug. It's a design tradeoff. Snowflake prioritizes query performance over instant metadata consistency.
Once I understood the metadata timing issue, I needed to find all the clones in my test account to verify they were set up correctly.
Snowflake has SHOW TABLES, SHOW DATABASES, SHOW SCHEMAS, SHOW VIEWS.
Naturally, I assumed there'd be:
SHOW CLONES IN ACCOUNT;What I Got :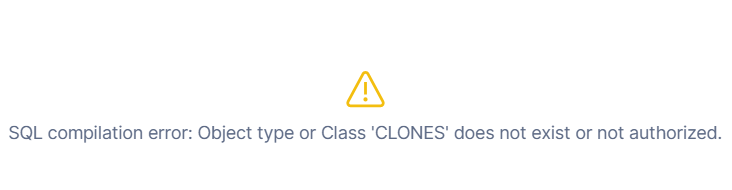 There is no
 SHOW CLONES command. I spent 15 minutes Googling, CHAT GPTing before accepting this reality.
SELECT
    table_catalog,
    table_schema,
    table_name,
    clone_group_id,
    table_created
FROM information_schema.table_storage_metrics
WHERE clone_group_id IS NOT NULL
ORDER BY table_created DESC;
When you clone a table, both original and clone get the same CLONE_GROUP_ID. That's the only way to track clone relationships.
No parent-child hierarchy. No "this is a clone of that" pointer. Just a shared ID that says "these tables share micro-partitions."
If you need to audit clones in your account, you must query TABLE_STORAGE_METRICS and filter by CLONE_GROUP_ID IS NOT NULL. There's no shortcut command.
Now that I could find my clones, I wanted to track the storage costs. My problem statement was specifically about RETAINED_FOR_CLONE_BYTES, the metric that shows how much storage a clone is holding onto after you drop the original table.
I expected: Drop the original, clone immediately shows RETAINED_FOR_CLONE_BYTES.
A few mins after dropping ORDERS:
TABLE_NAME | TIME_TRAVEL_MB | RETAINED_CLONE_MB |
ORDERS | 3.57 | 0.0 |
ORDERS_DEV | 0.0 | 0.0 |
ORDERS entered Time Travel. ORDERS_DEV showed zero retained bytes.
1 hour later (checking ACCOUNT_USAGE):
TABLE_NAME | DELETED | RETAINED_CLONE_MB |
ORDERS | TRUE | 0.0 |
ORDERS_DEV | FALSE | 0.0 |
ORDERS was marked deleted, but ORDERS_DEV still showed zero. Where's the storage?
24+ hours later (after Time Travel expired):
TABLE_NAME | RETAINED_CLONE_MB |
ORDERS_DEV | 3.57 |
There it is.
While the original table is in Time Travel, it still technically owns the micro-partitions. The clone references them but doesn't own them yet.
Only after Time Travel expires does ownership transfer to the clone, and RETAINED_FOR_CLONE_BYTES populates.
This takes 24+ hours depending on your Time Travel retention setting (mine was 1 day).
You're charged for storage the whole time. Snowflake doesn't double-charge during Time Travel. But the metric won't appear where you expect it until ownership fully transfers.
At this point, I was thoroughly confused. I'd been checking both INFORMATION_SCHEMA and ACCOUNT_USAGE to track down these issues, and they kept showing me different things.
I queried both views for the same table at the same time. Got different results.
What I'm Doing | View I Use | Why |
Quick operational checks | INFORMATION_SCHEMA | Updates within minutes |
Billing & cost analysis | ACCOUNT_USAGE | Source of truth for billing |
Clone retention monitoring | ACCOUNT_USAGE | Only reliable for RETAINED_FOR_CLONE_BYTES |
"Is this table huge?" checks | INFORMATION_SCHEMA | Good enough for ballpark numbers |
Historical analysis | ACCOUNT_USAGE | Keeps dropped table history |
INFORMATION_SCHEMA = Fast but can be slightly outdated
ACCOUNT_USAGE = Slow (45min-3hr lag) but authoritative
For RETAINED_FOR_CLONE_BYTES specifically, I only trust ACCOUNT_USAGE. INFORMATION_SCHEMA can miss retained clone storage entirely after Fail-safe expires.
Using the wrong view led me to incorrect cost analysis. I was checking INFORMATION_SCHEMA, saw no retained bytes, and thought my clones weren't costing anything. They were. I was just looking in the wrong place.
After all these discoveries, I realized I needed to change how I write monitoring queries and automation scripts.
The Model I Had in My Head
DROP TABLE → Metadata updates → Queries show new stateWhat Actually Happens
DROP TABLE →
  Control plane (instant) →
    Metadata snapshot refresh (5-15 min) →
      INFORMATION_SCHEMA updated →
        ACCOUNT_USAGE updated (45min-3hr later) →
          Everything's consistent
What I Changed
In monitoring queries, I added time buffers:
WHERE table_dropped < DATEADD(hour, -1, CURRENT_TIMESTAMP())For cost reports, I only use ACCOUNT_USAGE: No mixing views in the same report. One source of truth, accept the latency.
Without understanding these delays, I got:
False alarms in monitoring (tables showing as "still exist" when they don't)
Incorrect cost attribution (retention costs not showing up yet)
Confusion when expected results didn't match reality
Metadata propagation isn't instant. Once I accepted that and built buffers, everything worked smoothly.
If you've ever queried Snowflake and thought "this doesn't match what I just did," you're not wrong. You're just ahead of the metadata refresh cycle.
The data's accurate. The billing's correct. Everything just needs a few minutes (or hours) to propagate through the system.
Once I understood the timing, the view differences, and which commands actually exist, Snowflake's behavior started making sense. It's not mysterious. It's just asynchronous.
My go-to rule now: When in doubt, wait 15 minutes and check ACCOUNT_USAGE.
Works most of the time. And when it doesn't, I wait another hour and check again.
May your metadata always catch up eventually.
Want to master Snowflake and prepare for the SnowPro Core Certification?
Check out the Snowpro Core Certification Path on Enqurious Academy and start your certification journey.

Navigate Databricks Marketplace like a pro. Learn the 5 key criteria for choosing AI models that match your agents, LLMs, and text generation needs—without the trial-and-error.
Spark optimization isn't always complex; some tweaks have a huge impact. Inferring schemas forces Spark to scan your data twice, slowing ingestion and inflating cost. Explicit schemas avoid the extra pass and make pipelines faster and cheaper.

Cricket is no longer just a game of "gut feelings." This blog uncovers how hidden metrics like Expected Wickets and "Ghost" simulations are winning matches before the first ball. Dive into the high-stakes world where data science meets the 22 yards to redefine the sport.
I tested a simple hypothesis about image similarity - and watched it fail spectacularly when my algorithm said a "3" looks more like an "8" than another "3". The investigation revealed why pixel-by-pixel comparison is too brittle and what humans do effortlessly that machines must learn explicitly.
Passed the Databricks Gen AI Associate Certification with 56 questions in 90 minutes! Here's my honest experience, preparation strategy, time management tricks, and the exact resources that helped me succeed. Real insights for aspiring certificants.

A practical walkthrough of how I reduced heavy batch workloads using Change Data Feed (CDF) in Databricks. This blog shows how CDF helps process only updated records, cutting compute costs and boosting pipeline efficiency.

The AI industry has a security problem: data scientists aren't trained in security, ML engineers are working with black-box models, and security pros don't understand GenAI. Learn about the frameworks and tools bridging this gap—from Llama Guard to Databricks' safety features.

Why DELETE isn’t enough under GDPR, and how Time Travel can make sensitive data reappear unless VACUUM is used correctly.

This blog shares my personal journey into Snowflake Gen AI, from early confusion to hands-on clarity. It offers practical study tips, common pitfalls, and guidance to help you prepare effectively and understand Snowflake’s evolving AI capabilities.

Started scrolling Instagram at 2 AM. Saw Cloudflare memes. Fell down a 4-hour research rabbit hole. Discovered that AND database = 'default' could have prevented the whole thing. My sleep schedule is ruined but at least I understand distributed systems now.

Discover the top 10 data pipeline tools every data engineer should know in 2025. From Airflow to Fivetran, learn how each tool powers modern data workflows, supports real-time analytics, and scales across cloud ecosystems.
Confused between a data lake, data warehouse, and data mart? Discover key differences, real-world use cases, and when to use each architecture. Learn how to build a modern, layered data strategy for scalability, governance, and business insights.
Explore what syntax means in the world of data and AI—from SQL and Python to JSON and APIs. Learn why syntax matters, common errors, real-world examples, and essential best practices for data engineers, analysts, and AI developers in 2025.
Discover how AWS Data Pipeline helps automate data movement and transformation across AWS services like S3, Redshift, and EMR. Learn its key features, benefits, limitations, and how it compares to modern tools like AWS Glue and MWAA.

Learn how to build scalable and secure data pipeline architectures in 2024 with best practices, modern tools, and intelligent design. Explore key pillars like scalability, security, observability, and metadata tracking to create efficient and future-proof data workflows.
Explore the key differences between ETL and ELT data integration methods in this comprehensive guide. Learn when to choose each approach, their use cases, and how to implement them for efficient data pipelines, real-time analytics, and scalable solutions.
Learn the essential role of ETL (Extract, Transform, Load) in data engineering. Understand the three phases of ETL, its benefits, and how to implement effective ETL pipelines using modern tools and strategies for better decision-making, scalability, and data quality.

Discover why data orchestration and analysis are essential for modern data systems. Learn how automation tools streamline data workflows, boost insights, and scale with your business
Learn what a data ingestion pipeline is, why it's vital for modern analytics, and how to design scalable, real-time pipelines to power your data systems effectively.

Discover the top 15 data warehouse tools for scalable data management in 2024. Learn how to choose the right platform for analytics, performance, and cost-efficiency.
Confused between a data mart and a data warehouse? Learn the key differences, use cases, and how to choose the right data architecture for your business. Explore best practices, real-world examples, and expert insights from Enqurious.
Discover the top 10 predictive analytics tools to know in 2025—from SAS and Google Vertex AI to RapidMiner and H2O.ai. Learn why predictive analytics is essential for modern businesses and how to choose the right tool for your data strategy.

Explore the key differences between descriptive and predictive analytics, and learn how both can drive smarter decision-making. Discover how these analytics complement each other to enhance business strategies and improve outcomes in 2025 and beyond.

Explore the key differences between predictive and prescriptive analytics, and learn how both can drive smarter decisions, enhance agility, and improve business outcomes. Discover real-world applications and why mastering both analytics approaches is essential for success in 2025 and beyond.
Compare PostgreSQL vs SQL Server in this comprehensive guide. Learn the key differences, strengths, and use cases to help you choose the right database for your business needs, from cost to performance and security.
Learn what Power BI is and how it works in this beginner's guide. Discover its key features, components, benefits, and real-world applications, and how it empowers businesses to make data-driven decisions.

Explore what a Business Intelligence Engineer does—from building data pipelines to crafting dashboards. Learn key responsibilities, tools, and why this role is vital in a data-driven organization.
Discover why data lineage is essential in today’s complex data ecosystems. Learn how it boosts trust, compliance, and decision-making — and how Enqurious helps you trace, govern, and optimize your data journeys.
Learn what a data mart is, its types, and key benefits. Discover how data marts empower departments with faster, targeted data access for improved decision-making, and how they differ from data warehouses and data lakes.

Master data strategy: Understand data mart vs data warehouse key differences, benefits, and use cases in business intelligence. Enqurious boosts your Data+AI team's potential with data-driven upskilling.
Learn what Azure Data Factory (ADF) is, how it works, and why it’s essential for modern data integration, AI, and analytics. This complete guide covers ADF’s features, real-world use cases, and how it empowers businesses to streamline data pipelines. Start your journey with Azure Data Factory today!
Discover the key differences between SQL and MySQL in this comprehensive guide. Learn about their purpose, usage, compatibility, and how they work together to manage data. Start your journey with SQL and MySQL today with expert-led guidance from Enqurious!
Learn Power BI from scratch in 2025 with this step-by-step guide. Explore resources, tips, and common mistakes to avoid as you master data visualization, DAX, and dashboard creation. Start your learning journey today with Enqurious and gain hands-on training from experts!
AI tools like ChatGPT are transforming clinical data management by automating data entry, enabling natural language queries, detecting errors, and simplifying regulatory compliance. Learn how AI is enhancing efficiency, accuracy, and security in healthcare data handling.
Big Data refers to large, complex data sets generated at high speed from various sources. It plays a crucial role in business, healthcare, finance, education, and more, enabling better decision-making, predictive analytics, and innovation.

Discover the power of prompt engineering and how it enhances AI interactions. Learn the key principles, real-world use cases, and best practices for crafting effective prompts to get accurate, creative, and tailored results from AI tools like ChatGPT, Google Gemini, and Claude.

Learn what a Logical Data Model (LDM) is, its key components, and why it’s essential for effective database design. Explore how an LDM helps businesses align data needs with IT implementation, reducing errors and improving scalability.
Discover the power of a Canonical Data Model (CDM) for businesses facing complex data integration challenges. Learn how CDM simplifies communication between systems, improves data consistency, reduces development costs, and enhances scalability for better decision-making.

Discover the 10 essential benefits of Engineering Data Management (EDM) and how it helps businesses streamline workflows, improve collaboration, ensure security, and make smarter decisions with technical data.

Explore how vibe coding is transforming programming by blending creativity, collaboration, and technology to create a more enjoyable, productive, and human-centered coding experience.

Learn how Azure Databricks empowers data engineers to build optimized, scalable, and reliable data pipelines with features like Delta Lake, auto-scaling, automation, and seamless collaboration.

Explore the top 10 data science trends to watch out for in 2025. From generative AI to automated machine learning, discover how these advancements are shaping the future of data science and transforming industries worldwide.

Discover the key differences between data scientists and data engineers, their roles, responsibilities, and tools. Learn how Enqurious helps you build skills in both fields with hands-on, industry-relevant learning.

Discover the 9 essential steps to effective engineering data management. Learn how to streamline workflows, improve collaboration, and ensure data integrity across engineering teams.
Azure Databricks is a cloud-based data analytics platform that combines the power of Apache Spark with the scalability, security, and ease of use offered by Microsoft Azure. It provides a unified workspace where data engineers, data scientists, analysts, and business users can collaborate.

In today's data-driven world, knowing how to make sense of information is a crucial skill. We’re surrounded by test scores, app usage stats, survey responses, and sales figures — and all this raw data on its own isn’t helpful.

In this blog, we will discuss some of the fundamental differences between AI inference vs. training—one that is, by design, artificially intelligent.

This guide provides a clear, actionable roadmap to help you avoid common pitfalls and successfully earn your SnowPro Core Certification, whether you’re making a career pivot or leveling up in your current role.

"Ever had one of those days when you’re standing in line at a store, waiting for a sales assistant to help you find a product?" In this blog we will get to know about -What is RAG, different types of RAG Architectures and pros and cons for each RAG.

Discover how Databricks and Snowflake together empower businesses by uniting big data, AI, and analytics excellence

How do major retailers like Walmart handle thousands of customer queries in real time without breaking a sweat? From answering questions instantly to providing personalized shopping recommendations, conversational AI reshapes how retailers interact with their customers.